In October 2015 my time training mathematics teachers at a French high school in Port Vila, Vanuatu, was coming to an end. The principal invited me to share kava, a traditional drink in the country. As every social scientist in Vanuatu discovers, sharing kava is a fruitful opportunity for learning. This beverage, which is made from the roots of a tree of the same name, relaxes the drinker and loosens the tongue.
This first encounter with kava was also my introduction to sand drawing. That evening, one of the trainees took out a large board covered with very fine sand. After carefully flattening the surface, he drew a grid of horizontal and vertical lines. Then he began tracing furrows in the sand without ever lifting his finger. When the artist finished, he explained in the language Bislama, “Hemia hem i wan fis i ronwe i stap unda ston from i kat wan sak,” meaning “It is a fish that hides under a stone to escape the shark.”
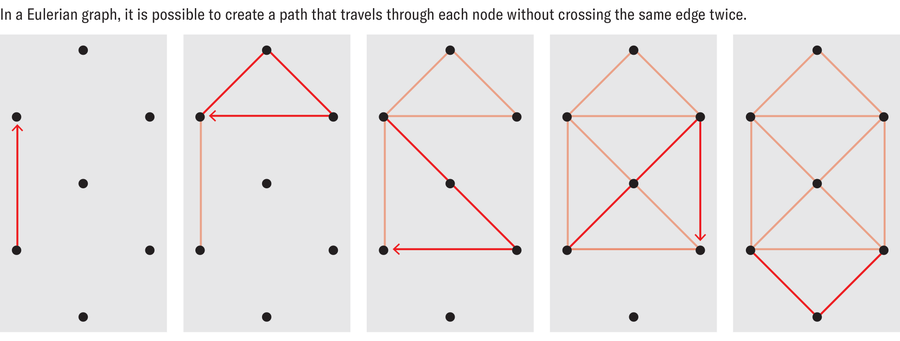
The fluidity of the line, mixed with the effects of kava, plunged me into a state of wonder. The technique reminded me of the classic challenge to draw a complex figure with a single stroke, without lifting one’s pen or going over the same line twice. It also called to mind a “Eulerian graph” in mathematics, which involves a trail that traverses every edge exactly once while starting and ending at the same point.
On supporting science journalism
If you’re enjoying this article, consider supporting our award-winning journalism by subscribing. By purchasing a subscription you are helping to ensure the future of impactful stories about the discoveries and ideas shaping our world today.
As I considered these ideas, an intern approached me and whispered, “Where is the mathematics in this drawing, teacher?” Though he could not have known it, that remark would go on to shape the next six years of my life, including my doctoral work on sand drawing. One question particularly inspired me: How were such drawings created?
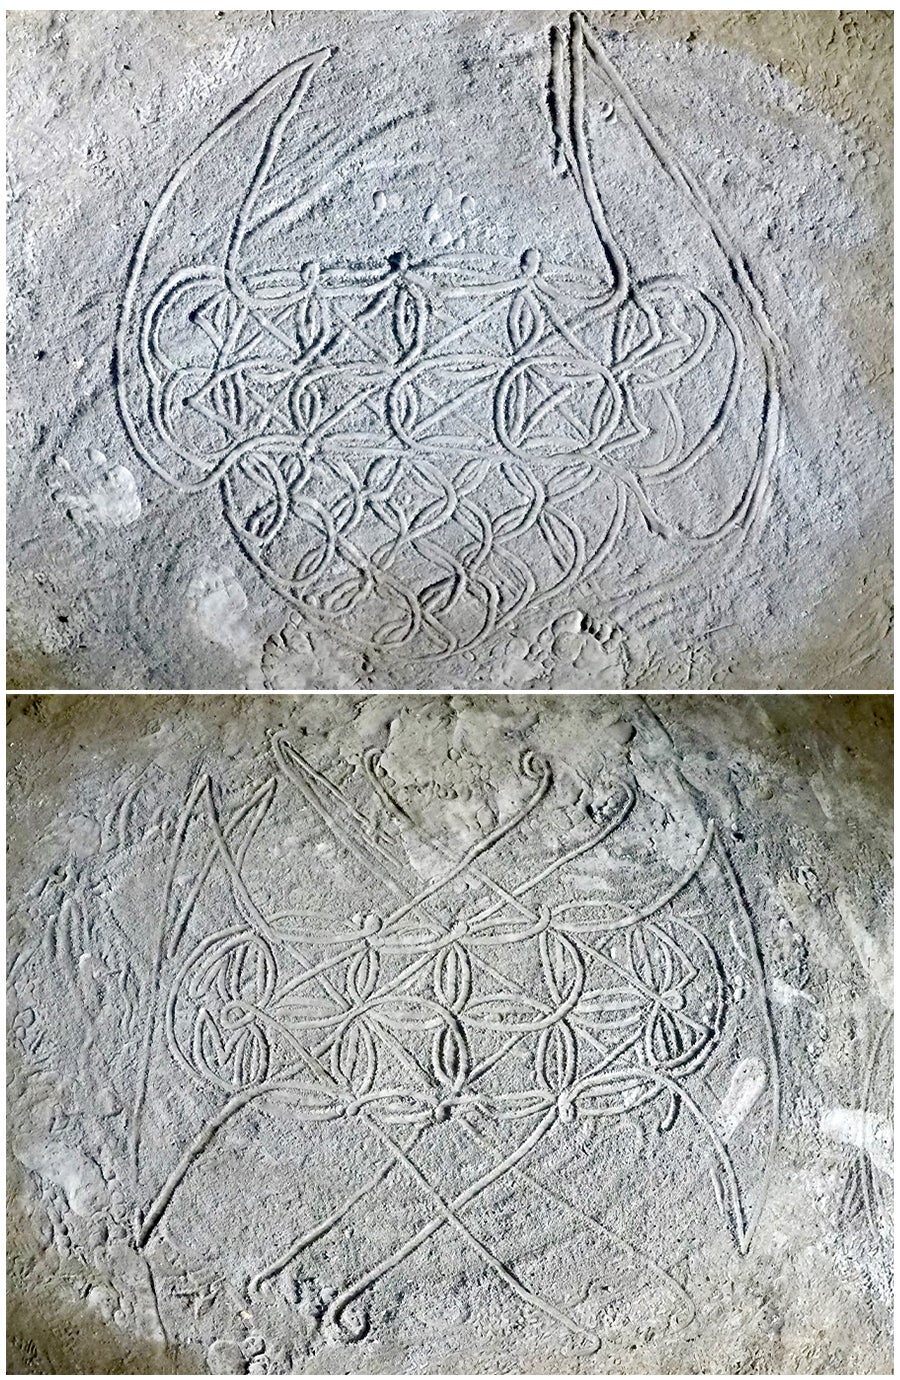
Sand drawings are complex figures drawn with a single finger stroke. Credit: Alban Da Silva
My investigation took me further than I could have imagined. By watching expert sand artists, learning about their methods, collecting drawings and history and exploring the work of 20th-century ethnologists, I have developed a mathematical model of sand drawing. My work shows that these artworks can be modeled as the result of algorithms and operations of an algebraic nature. Indeed, mathematical language turns out to be appropriate for describing the work of sand drawing experts. Furthermore, sand drawing can help us understand the relationships that Vanuatu societies maintain with their environment.
[Read more about ethnomathematics]
A Traditional Art
Vanuatu is an archipelago with a population of some 315,000 people spread throughout 83 islands. The country has the highest linguistic density in the world, with 138 vernacular languages. The two official languages taught in school are French and English. Bislama, or bichlamar, an Anglo-Melanesian pidgin used in Vanuatu, is the common language.
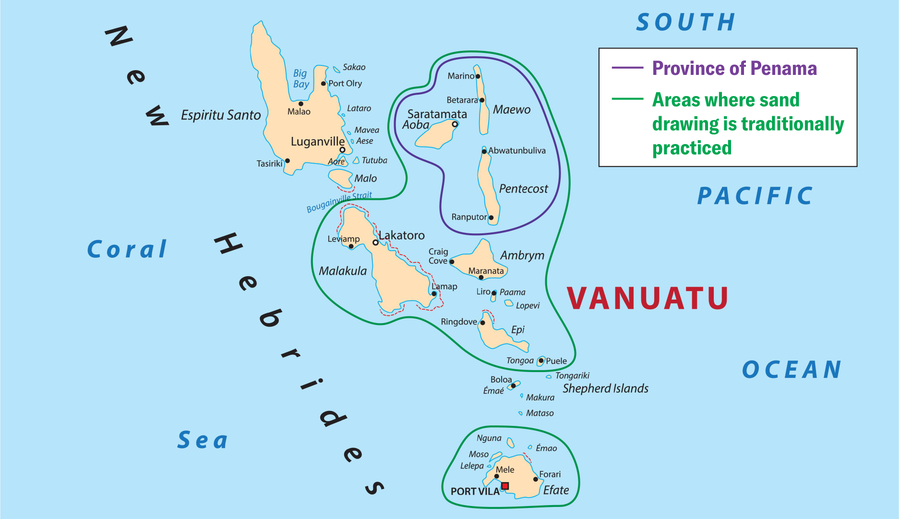
A map shows a portion of the archipelagic country of Vanuatu. Ethnomathematician Alban Da Silva studied sand drawing in the nation’s province of Penama, specifically on the islands of Maewo and Pentecost. Credit: Rainer Lesniewski/Alamy Stock Vector (map); Amanda Montañez (green and purple outlines and key)
Cultures vary in the north and south of the country and even within the same island. The sand drawing practice is widespread only in some central islands, for example. Although the tradition is reminiscent of drawings done on soil in Tamil Nadu, India, it is unique in many ways. In 2008 UNESCO classified the sand drawing of Vanuatu as part of the intangible cultural heritage of humanity.
My research is based on two field surveys that were conducted on Maewo Island in 2018 and Pentecost Island in 2019 and that particularly focused on drawings made by people in the Raga region (pronounced “Ra-ra”) on northern Pentecost Island. These islands, along with Aoba Island, constitute the province of Penama and are bound by common traditions, which greatly facilitated my research.
“Sand drawing,” or sandroing, as it is known in Bislama, is probably thousands of years old. Traditionally, it consists of a person drawing a continuous, closed line with their finger in beaten earth, sand beaches or ashes. (The words “continuous” and “closed” have the same meaning here as in mathematics: a drawing in the sand is similar to the closed continuous curve of a plane.) This drawn line is constrained by a composite grid of lines or dots. The grid can be rectangular or circular.
Although it is difficult to know how many designs are in use, it is clear that, over time, new ones appear, and others disappear. A system very close to intellectual property protects these drawings, making access to this traditional knowledge sometimes sensitive and challenging.
These artworks are multidimensional in their significance. Some iconic drawings of animals, insects or plants are closely linked with the beliefs, cosmogonies, social organization or even traditions of these societies—which are grouped together under the generic name of kastom. The drawings can also support narratives; they reveal the ethical or political dimensions of societies in central Vanuatu. In many cases, each design bears a vernacular name related to these different aspects.
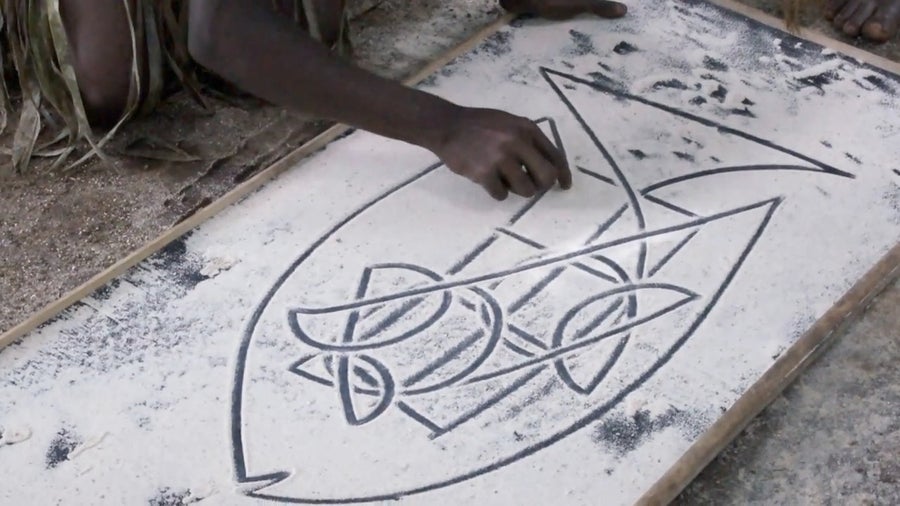
A sand drawing evokes a fish hiding under a stone to escape a predator. Credit: Alban Da Silva
Today these societies recognize this practice as a traditional graphic art that helps people recall ritual, religious and environmental knowledge. In addition, Jief Todali, a chief whom I met in the Raga region, explained to me that the artists are spokespeople: “Before the arrival of the tuturani [the white foreigners], the people of northern Pentecost did not know how to speak. They expressed themselves through drawings that they traced on the ground with their fingers. Instead of people, the rocks, the stones, the ground of the hills and valleys, the wind, the rain, the water of the sea spoke. But now the situation is reversed. It is the people who speak, and the earth, the wind, the rain and the sea are silent. Now [the people from the Raga region] sometimes say, ‘We have to speak for the land because it can no longer speak for itself.’”
Finally, this ephemeral art—each drawing is erased once it is finished—stimulates storytelling. Practitioners generally pair their drawings with the telling of a tale, and the most gifted ones are able to do this while drawing. It is not uncommon for them to appeal to the imagination of spectators by adding details related to their history, including familiar places, characters, animals and even vegetables.
Experts and Rules
There are different levels of expertise and practice. Some people don’t practice sand drawing at all. Others know a few rather simple drawings. “Experts”—designated as such by the rest of their society—have an impressive repertoire (up to 400 drawings, according to some). While the first ethnographies of sand drawing mentioned that this art was reserved for men, that is not the case today. Several women I met had a high level of expertise.
From beginners to experts, everyone follows a set of “rules.” Because these communities have an oral tradition, there is no written record, but during my field survey, I drew up a list of principles that are followed in most cases. All drawings begin with a grid that provides support and defines a set of nodes, or crossing points, and lines.
An animation reveals a classic turtle-shaped sand drawing design. Credit: Alban Da Silva
Rules then indicate the movements that are allowed. More precisely, an artist must (1) go from node to node without crossing the same path or cutting the grid other than at its nodes and (2) must return to the starting point without lifting their finger.
There was an additional rule that I discovered in the field that turned out to be critical to my model, as discussed below.
Marcia Ascher’s Intuition
I was not the first person to recognize the resemblance of these rules to concepts from mathematics. In fact, my thesis is a continuation of work carried out in the 1980s by American mathematician Marcia Ascher, a pioneer of ethnomathematics. In sand drawings, she argued, there was a clear connection to what mathematicians call graph theory and especially to Eulerian graphs.
To appreciate how revolutionary Ascher’s perspective was, consider that before her work and that of her contemporaries, scholars generally assumed that only societies with writing could truly practice mathematics. They constrained their investigations of mathematical knowledge to textual sources and ignored many other practices seen in societies with oral traditions that did not use a written language.
But since the advent of ethnomathematics, some scholars have begun to overturn these assumptions. The shift undoubtedly began in the 1940s, when mathematician André Weil demonstrated, in a now famous appendix to anthropologist Claude Lévi-Strauss’s book The Elementary Structures of Kinship, that the kinship rules of the Australian Yolngu followed what are called non-trivia group laws. Since then researchers have identified mathematical principles in many other places, including sowing games and divination in Madagascar, string games on Papua New Guinea’s Trobriand Islands, textiles in the Andes and ornamental window hangings on the island of Réunion.
Ascher’s work on sand drawing drew on that of a young ethnographer, Bernard Deacon, who had collected and transcribed more than 100 sand drawings from Malekula and Ambrym Islands in Vanuatu in 1926 and 1927. Ascher studied those figures and realized that these images could be described mathematically.
Each sand drawing could be thought of as a “graph” in the sense that it included vertices, or dots, connected by edges, or lines. (This definition of graph is a special one in mathematics. In graph theory, graphs are simple figures made up of vertices and edges to map out the connections of many nodes in a network—such as cities linked by roads, computers linked by the Internet or even people linked by social ties.)
Ascher observed that in the sand drawings, the line traced in the sand was comparable to a graph whose vertices included all the crossings created in the pattern. The edges were all the arcs between those vertices. These graphs were also Eulerian, meaning that the sand artist had to visit each edge only once and had to return to a starting point. Ascher also documented the number of edges per vertex, which mathematicians call the “degree” of the vertex. This was important because, according to Euler’s theorem, created by mathematician Carl Hierholzer, a connected graph is Eulerian only if each vertex has an even degree.
Credit: Alban Da Silva/Pour la Science, restyled by Amanda Montañez
The fact that Ascher never had the opportunity to go to Vanuatu to see the designers at work undoubtedly limited her research. My own research, therefore, could go further. One particular observation of Ascher’s propelled my study of how these images are created. By examining Deacon’s drawings, she had observed that some of these graphs could be broken down into three or four substeps that, when linked together, formed the final drawing. Put another way, each step produced a subdrawing that returned to the starting point. When these subdrawings were superimposed, the final drawing was revealed. I called this process of identifying subdrawings “decomposition.”
These subdrawings raised several questions for my work: Is this type of decomposition possible for every drawing? How did these layers fit together, and did the order matter? Above all, what did these layers represent for the sand artists?
To investigate, I sought to first refine the graph model proposed by Ascher and then determine whether computers could generate an automated breakdown of the sand drawings. Ascher had proposed modeling sand drawings with a set of patterns subjected to transformations (such as rotation, translation, symmetry and inversion). But while listening to the creators of sand drawings, I realized that transformations did not play a fundamental role in the execution of their designs. In fact, they used the same term to designate a motif, whatever its orientation on the grid. I therefore needed another way to describe the approach of these sand artists.
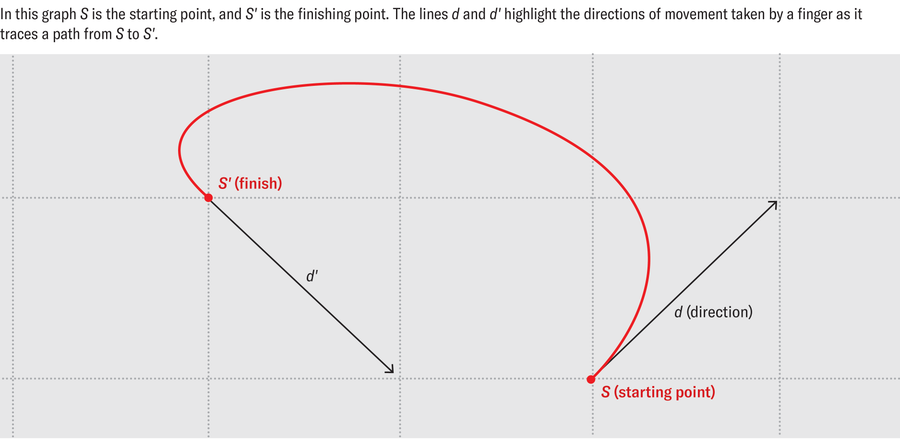
The artists themselves helped me in this effort. Graphs are very useful for modeling a set of relationships (edges) between objects (vertices). But in her work, Ascher did not consider the nature of these relations. By emphasizing the nodes of the grid, the vertices of the graph and the curves at the edges, she overlooked the ways in which the artist would move from one peak to another. While questioning the experts, I observed that, for them, the direction of the movement is as important as the nodes: the designer’s finger moves from node to node, from an initial direction to a final direction, so that the nodes play different roles when they are crossed, according to one or the other of the two possible diagonals.
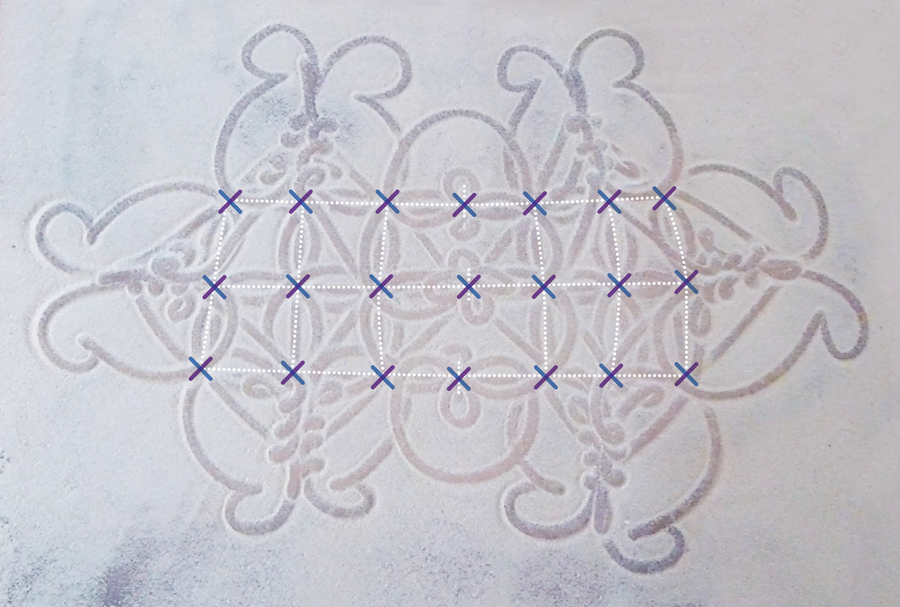
At each node or crossing point within this sand drawing, the finger takes one of two diagonal paths (purple and blue). Credit: Alban Da Silva/Pour la Science, restyled by Amanda Montañez
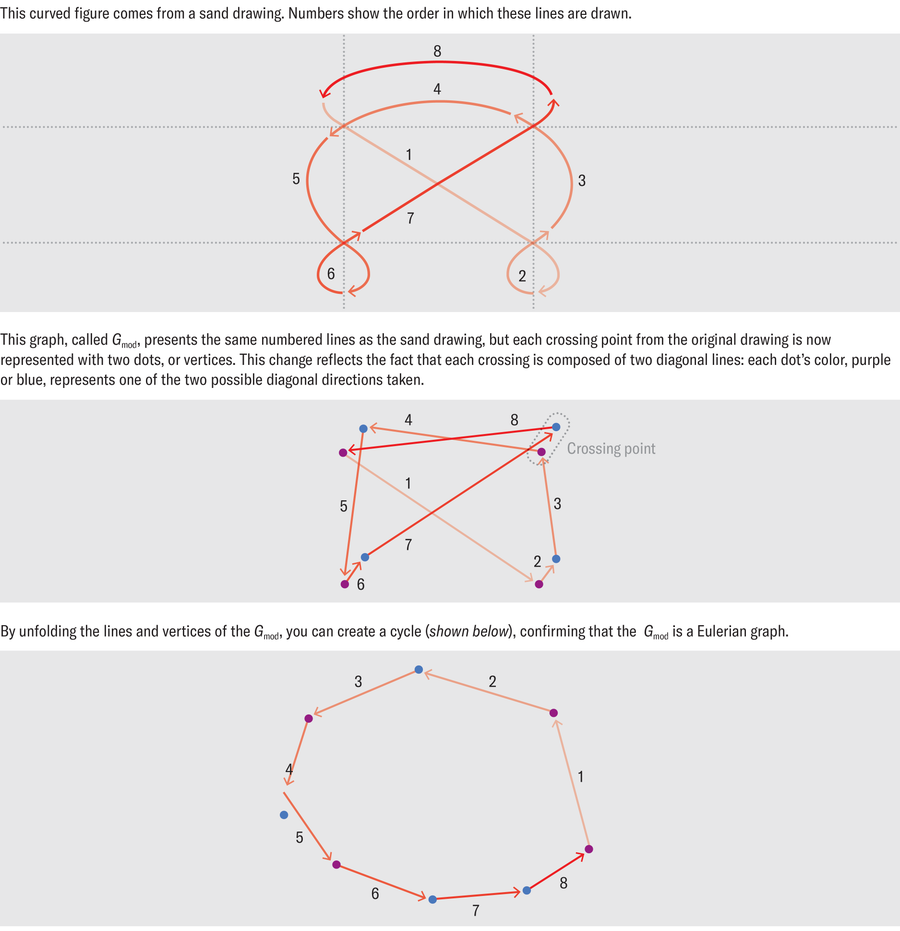
To model the sand design with a graph, therefore, it is possible to create a graph in which every node of the grid is treated not as one but rather two vertices that are each assigned to a diagonal. We thus obtain a new graph—named Gmod—whose vertices are not the nodes S of the grid, as Ascher proposed, but instead the pairs (S, d).
Credit: Alban Da Silva, restyled by Amanda Montañez
In this graph, d is the direction taken, and each movement of the drawing that leaves from S in the direction d and arrives in S’ in the direction of d’ corresponds to an edge between the vertices (S, d) and (S’, d’). And this resulting Gmod graph is still Eulerian!
Credit: Alban Da Silva, restyled by Amanda Montañez
A Theorem Discovered in Drawings
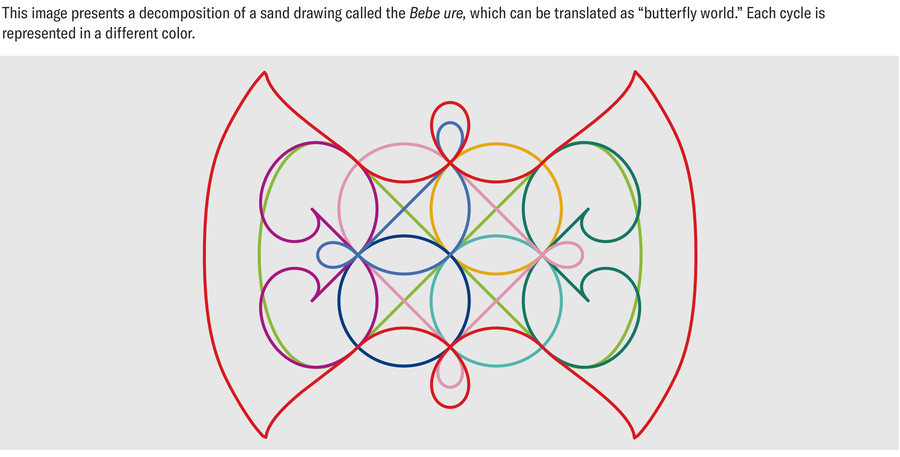
In 1912 mathematician Oswald Veblen identified another characteristic of Eulerian graphs in what has since been called Veblen’s theorem: a graph is Eulerian if and only if it can be broken down into a union of disjoint cycles. In graph theory, the word “cycle” refers to a sequence of distinct consecutive edges whose start and end vertices are identical.
It turns out that the cycles of the Gmod graph correspond to those of a sand drawing, which can therefore be broken down as a disjoint union of cycles.
Does this approach distance us from sand drawers? I would argue that it does not. On the contrary, cycles can provide keys to better understanding their approach. Of the 60 or so drawings that I have collected, I have noticed that artists sometimes take breaks in their drawing when they complete a cycle. Moreover, when a sand drawer is forced to find another path (a rod in Bislama), they tend to rearrange the typical cycle order that they use in their drawing or to try to find another decomposition into cycles.
Finally, some cycles have vernacular names, which suggests that they are like building blocks for the artists. In fact, this focus on graph cycles also seems to echo the stories that accompany the drawings, which play a fundamental role in the way Vanuatu societies understand the world. In my research, I have also suggested that some cycle decompositions might be linked to the way these societies conceive of their relationship with nonhumans.
These results raise questions about the universality of mathematics and the form that math takes in other cultures. They open up perspectives for teaching mathematics as well. Since 2010 the acquisition of traditional knowledge such as sand drawing has been one of the objectives of Vanuatu schools, and it is part of a larger movement to decolonize education, much like efforts in Hawaii and in the French territory of New Caledonia. In the current school curriculum, however, no link is made between sand drawing and mathematics. To that end, Vanuatuan Pierre Metsan, a doctoral student in education at the University of New Caledonia, is studying whether the practice of sand drawing could support mathematics instruction. We can look forward to what he learns from this investigation in the years to come.
This article originally appeared in Pour la Science and was reproduced with permission.


